


Title: Unlocking the Future: A Practical Guide to Predictive Analytics for Business Success

—
Introduction – Why “Predictive” Is the New Competitive Edge
Imagine you could glance at tomorrow’s sales numbers, spot the next churn‑prone customer, or anticipate equipment failures before they happen. That’s the promise of predictive analytics—the art and science of turning raw data into forward‑looking insights.
In today’s data‑driven economy, businesses that simply react are quickly overtaken by those that predict. According to a recent Gartner study, organizations that embed predictive analytics into their decision‑making processes enjoy up to 30% higher profit margins and 25% faster time‑to‑market for new products.
But predictive analytics isn’t a magic crystal ball reserved for tech giants. With the right mindset, tools, and step‑by‑step methodology, any company—big or small—can start forecasting, optimizing, and winning. In this 2,000‑word guide, we’ll demystify the core concepts, walk through a practical workflow, and share actionable tips you can implement today.
Let’s dive in and see how you can transform data into your most powerful strategic asset.
—
1. Foundations of Predictive Analytics: From Data to Decision
1.1 What Exactly Is Predictive Analytics?
At its core, predictive analytics is a branch of data science that uses statistical algorithms, machine learning models, and historical data to forecast future outcomes. Unlike descriptive analytics (what happened) or diagnostic analytics (why it happened), predictive analytics answers the question “What is likely to happen next?”
Key terms you’ll encounter:
| Term | Simple Definition |
|——|——————-|
| Predictive Modeling | Building mathematical models that estimate future events. |
| Machine Learning (ML) | Algorithms that improve automatically through experience. |
| Big Data | Large, complex data sets that traditional tools can’t handle. |
| Feature Engineering | Transforming raw data into meaningful inputs for a model. |
| Model Validation | Testing a model’s accuracy on unseen data. |
1.2 Why Predictive Analytics Matters for Every Business
1. Proactive Decision‑Making – Anticipate demand spikes, staffing needs, or supply‑chain disruptions.
2. Customer Retention – Identify churn risk early and intervene with personalized offers.
3. Cost Reduction – Predict equipment failures to schedule preventive maintenance, saving downtime.
4. Revenue Growth – Upsell or cross‑sell by forecasting which products a customer is likely to buy next.
1.3 The Predictive Analytics Workflow – A High‑Level Roadmap
1. Define the Business Problem – Translate a strategic goal into an analytical question.
2. Collect & Prepare Data – Gather internal (CRM, ERP) and external (social media, weather) data sources.
3. Explore & Engineer Features – Use statistical analysis and domain knowledge to shape the data.
4. Select & Train Models – Choose algorithms (e.g., regression, decision trees, neural networks) and fit them to the data.
5. Validate & Tune – Evaluate performance with metrics like RMSE, AUC, or F1‑score; fine‑tune hyperparameters.
6. Deploy & Monitor – Integrate the model into production, set alerts, and continuously retrain with fresh data.
Understanding this pipeline is the first actionable step. In the next sections, we’ll unpack each stage with concrete tips you can apply right away.
—
2. Building a Predictive Model: From Raw Data to Actionable Insight
2.1 Step 1 – Clearly Define the Problem
A vague goal like “increase sales” leads to scattered efforts. Instead, craft a SMART predictive objective:
- Specific: “Predict the probability a new lead will convert within 30 days.”
- Measurable: Target a lift of at least 10% in conversion rate.
- Achievable: Use existing lead‑scoring data and marketing touchpoints.
- Relevant: Aligns with the sales team’s quarterly quota.
- Time‑Bound: Model to be refreshed weekly.
- Missing values: Impute with median (numeric) or mode (categorical) or use model‑based imputation.
- Outliers: Apply winsorization or robust scaling.
- Duplicates: Remove exact matches; keep the most recent record.
- Train‑Test Split: 70/30 or 80/20, ensuring temporal integrity for time‑series data (train on older periods, test on newer).
- Cross‑Validation: Use k‑fold (k=5) for robust error estimates.
- Hyperparameter Tuning: Leverage Grid Search, Random Search, or Bayesian Optimization (Optuna, Hyperopt).
- Hold‑out set: Keep a final untouched dataset for final performance check.
- Time‑Series Backtesting: Rolling windows to mimic real‑world forecasting.
- Bias‑Variance Trade‑off analysis: Plot training vs. validation error to detect overfitting.
- Data drift detection: Compare feature distributions between training and production data (e.g., using Kolmogorov‑Smirnov test).
- Model decay tracking: Plot key metrics (AUC, MAPE) over time; set alerts when they fall below thresholds.
- Explainability: Use SHAP or LIME to surface why a model made a specific prediction, building trust with end‑users.
- Demand Forecasting: Predict weekly sales per SKU to optimize inventory and reduce stock‑outs.
- Personalized Recommendations: Use collaborative filtering combined with predictive churn scores to surface items a shopper is most likely to buy.
- Dynamic Pricing: Model price elasticity and adjust prices in real time to maximize margin.
- Credit Scoring: Predict default probability using logistic regression and gradient boosting.
- Fraud Detection: Real‑time anomaly detection with unsupervised clustering and supervised classification.
- Customer Lifetime Value (CLV): Forecast future revenue per client to prioritize high‑value relationships.
- Readmission Risk: Predict which patients are likely to be readmitted within 30 days, enabling proactive care plans.
- Disease Progression: Use time‑series models on lab results to anticipate disease flare‑ups.
- Resource Allocation: Forecast ICU bed occupancy to better manage staffing.
- Predictive Maintenance: Model equipment sensor data (vibration, temperature) to schedule repairs before failure.
- Quality Control: Predict defect rates based on production line parameters, reducing waste.
- Supply‑Chain Optimization: Forecast lead times and demand to adjust procurement strategies.
- Churn Prediction: Identify at‑risk subscribers and trigger retention campaigns.
- Campaign ROI Forecasting: Estimate the incremental lift of a new ad spend before launch.
- Sentiment Analysis: Predict brand sentiment trends from social media streams.
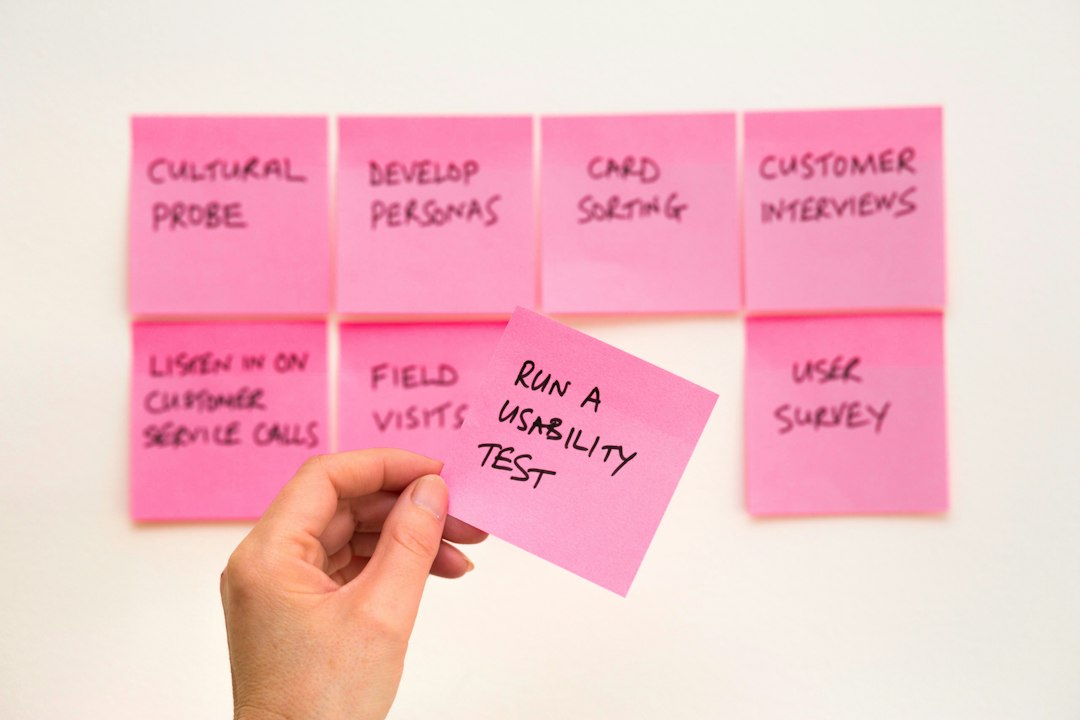
Actionable tip: Write the problem statement on a sticky note and place it on your dashboard. It keeps the team focused on the right metric.
2.2 Step 2 – Data Collection & Integration
Where to look:
| Source | Typical Predictive Variables |
|——–|—————————–|
| CRM | Lead source, interaction history, deal size. |
| ERP/Inventory | Stock levels, lead times, supplier performance. |
| Web Analytics | Page views, click‑through rates, session duration. |
| Social Listening | Sentiment scores, brand mentions. |
| External | Economic indicators, weather, demographic data. |
Actionable tip: Use a data lake (e.g., Amazon S3, Azure Data Lake) to store raw files, then layer a data warehouse (Snowflake, BigQuery) for structured queries. This separation keeps raw data untouched while giving analysts fast access to clean tables.
2.3 Step 3 – Data Cleaning & Feature Engineering
Cleaning essentials:
Feature engineering ideas:
| Feature | Why It Helps | Example |
|———|————–|———|
| Recency | Recent interactions often predict near‑term behavior. | Days since last website visit. |
| Frequency | Higher touch frequency signals interest. | Number of emails opened in past 30 days. |
| Monetary | Spending power influences conversion. | Total historical spend. |
| Lag Variables | Past values can forecast future trends. | Sales of last month as predictor for next month. |
| One‑Hot Encoding | Converts categorical data into numeric format. | “Lead Source = Social Media” → binary column. |
Actionable tip: Create a feature store (e.g., Feast, Tecton) to version and reuse engineered features across multiple models. This reduces duplication and ensures consistency.
2.4 Step 4 – Model Selection & Training
Choosing the right algorithm:
| Scenario | Recommended Model | Reason |
|———-|——————-|——–|
| Binary outcome (e.g., churn yes/no) | Logistic Regression, Gradient Boosting (XGBoost, LightGBM) | Handles class imbalance, interpretable. |
| Continuous forecast (e.g., sales volume) | Linear Regression, Prophet, LSTM neural nets | Captures trends & seasonality. |
| Complex patterns (e.g., image classification) | Convolutional Neural Networks (CNN) | Learns spatial hierarchies. |
| Real‑time scoring | Decision Trees, LightGBM | Fast inference latency. |
Training best practices:
Actionable tip: Start with a baseline model (e.g., simple logistic regression). If it already meets business thresholds, you may not need a more complex model, saving time and computational cost.
2.5 Step 5 – Model Evaluation & Validation
Select metrics aligned with the business objective:
| Business Goal | Metric | Interpretation |
|—————|——–|—————-|
| Maximize conversions | Precision | Proportion of predicted positives that are true positives. |
| Minimize false alarms (e.g., churn alerts) | Recall (Sensitivity) | Ability to capture actual churners. |
| Balanced performance | F1‑Score | Harmonic mean of precision & recall. |
| Revenue impact | Lift / ROI | Incremental revenue per model‑driven action. |
| Forecast accuracy | Mean Absolute Percentage Error (MAPE) | Average absolute error as a percentage of actual values. |
Validation techniques:
Actionable tip: Create a model performance dashboard (Power BI, Tableau, Looker) that updates automatically after each training run. Stakeholders can see accuracy trends at a glance.
2.6 Step 6 – Deployment, Monitoring, and Continuous Improvement
Deployment options:
| Option | Ideal For | Deployment Method |
|——–|———–|——————-|
| Batch scoring | Daily forecasts, nightly churn lists | Scheduled Spark jobs, Cloud Functions. |
| Real‑time API | Personalization on web pages, fraud detection | Flask/FastAPI microservice behind a load balancer. |
| Embedded in BI tools | Business users need point‑and‑click predictions | Power BI AI visuals, Tableau Extensions. |
Monitoring essentials:
Actionable tip: Schedule a monthly retraining cycle with the latest data. Automate the pipeline using Airflow, Prefect, or Azure Data Factory to reduce manual effort.
—
3. Real‑World Applications: How Industries Leverage Predictive Analytics
3.1 Retail & E‑Commerce
Actionable tip: Start with a simple ARIMA model for top‑selling items; compare its forecast error to a baseline moving average. If ARIMA improves accuracy by >10%, expand to a full Prophet or LSTM solution.
3.2 Financial Services
Actionable tip: Incorporate explainable AI (XAI) tools to satisfy regulatory requirements (e.g., GDPR, FCRA) when presenting credit decisions.
3.3 Healthcare
Actionable tip: Partner with clinical experts early in the feature engineering stage to ensure variables (e.g., comorbidities, medication adherence) are medically meaningful.
3.4 Manufacturing & IoT
Actionable tip: Deploy a edge‑computing inference engine (e.g., TensorFlow Lite) on the shop floor for ultra‑low latency anomaly alerts.
3.5 Marketing & Customer Experience
Actionable tip: Combine predictive scores with A/B testing—run a pilot campaign only for the top‑20% churn‑risk customers and measure actual lift versus predicted.
—
4. Best Practices & Pitfalls to Avoid
4.1 Keep the Business Goal Front‑and‑Center
Data scientists love to experiment, but every model must answer a clear business question. Regularly check: “If we implement this model, what tangible outcome will we see?”
4.2 Prioritize Data Quality Over Quantity
A massive, noisy dataset can produce worse predictions than a clean, smaller one. Invest in data governance: data lineage, validation rules, and ownership.
4.3 Embrace Explainability
Stakeholders (especially in regulated industries) need to understand why a model predicts a certain outcome. Tools like **SHAP